≈ 28 min read · September 15, 2021
Title: SKIN IN THE GAME AND ENGINEERING TRAINING
Author Name: Eng.Benard Mumo Makaa, PE, MIEK
Abstract
This paper, heuristically using case studies, explores engineering education and training and the role of having skin in the game by all concerned stakeholders. Based on case studies, it demonstrates that the economic development of a country is tied to the number and quality of its engineering output. Societies whose policymakers have skin in the game tend to draft bottom-up policies and those that serve the country’s interests. When policymakers and implementers know they must suffer the direct consequences of their actions, they will tend to alleviate such by engaging in that which spurs the economic development of a country. In 1963, output per worker in the United States was 12 times higher than output per worker in Kenya. In the same year, output per worker in the United States was ten times higher than output per worker in South Korea. In 2013, 50 years later, output per worker in the United States was 15 times higher than output per worker in Kenya. In the same year, output per worker in the United States was 1.7 times higher than output per worker in South Korea. This paper explores the role of engineering training, policy-making with skin in the game and if these could explain such a glaring difference in the differences between Kenya’s and South Korea’s (or other countries such as Singapore) output per worker in 1963 and 2013.
Key Words: Skin in the Game, Engineering Education, Output per Worker, and Engineering Output
- Introduction
Royal Academy of Engineering defines engineering as the ‘creative application of scientific principles’, principles that are put into practice to invent, design, build and improve structures, machines, systems, devices, materials and processes (Royal Academy of Engineering, 2016). Engineers make things, make things work and make things work better. By using their creativity, they design solutions to the world’s problems and help build the future. Because of the dynamic nature of engineering-related industries, its scope is continually evolving and cannot be narrowly defined.
The main fields in engineering include (but not limited to);
- Electrical and Electronic Engineering.
- Mechanical Engineering.
- Aeronautical Engineering.
- Civil, Environmental Engineering.
- Agricultural Engineering.
- Nuclear Engineering.
- Industrial and Management Engineering.
- Mining and Materials Engineering.
- Chemical and Process Engineering.
Many of the important advances in all known fields are a result of engineering developments. Engineers have been a key in building the infrastructure surrounding us, from roads to utility networks (power, telecommunication, water). They play huge roles in the development of new materials, including the foods that we eat. Engineers continue to play a key role in helping countries progress across the world, especially now with half the world living in poverty and millions of people without sufficient food and sanitation.
The engineering role is indispensable in supporting the growth and development of a country’s economy and also in improving the quality of life for its citizens. Thus, there is a connection between a country’s engineering capacity and its economic development. This is, of course, cognizant that the extent to which engineering can aid in development is also tied to the government’s commitment to providing finances and resources required for infrastructure projects and providing a favourable business environment with good regulation and without corruption. Consider Kenya’s current government focus on the Big Four agenda, i.e. Expansion of the Manufacturing Sector, Affordable Housing, Affordable Healthcare, and Food Security can only be sustainably achieved by empowering and increasing the local engineering capacity. Every one of these agendas involves massive engineering works and innovations. Engineering can contribute to economic development through many different channels. As highlighted before, by investing in infrastructures such as bridges, transport, communication, waste management, dams, water supply and sanitation, energy and digital infrastructure, countries can raise their productivity and improve other economic variables.
Royal Academy of Engineering, through the Centre for Economics and Business Research (Cebr), came up with an index called “Engineering Index”, which is a measure of the engineering strength of different countries. The index comprises factors such as engineering wages, exports, employment, businesses, graduates, infrastructure quality and the gender balance in engineering. However, due to the unavailability of data in many countries, the index captures 99 countries only (Royal Academy of Engineering, 2016).
The key finding of the index is that the highest-ranking countries by Engineering Index score are located either in the regions of Europe or Asia and North America. These are the same countries with durable and sustainable engineering capacity. The Engineering Index also notes that there is, therefore, likely to be potential for economic development for countries currently lagging in certain engineering indicators, such as employment or wages. The authors also noted that there is evidence to support a strong, positive link between engineering strength and gross domestic product (GDP) per capita, and investment per capita, both indicators of economic development.
It is a historical fact that there is a close connection to the development of countries with the emergence of engineers, engineering practice and engineering practice (Downey and Lucena, 2004; Downey and Lucena, 2005). The first known school of engineering was founded in France to support state consolidation and expansion. For countries that developed as empires and colonies, their engineers worked both for the international organization and expansion of the empires and in the colonies as agents of imperial development.
For the countries with high engineering indexes and high output per worker, it has not always been the case. On many occasions, for example, in the United States, foreign engineers were invited to work alongside national engineers when the US did not have the financial capital, in-house experience, engineering education or machinery to build infrastructure projects. For example, For example, French engineers were invited by the US government to develop engineering curricula in West Point Military Academy and build and supervise road construction (Hunter and Dooley, 1989). U.S and Canadian engineers were invited to Sao Paulo, Brazil, to develop the automobile industry and construct urban electric rail transportation (da Silva Telles, 1993). Due to strategized transfer of knowledge and expertise, the US and Brazil are now Industrial Powerhouses. Instead of delivering large aid packages or building infrastructural projects, as is the case in some countries, the key to technology transfer is in the diffusion of technical information to help local engineers develop technical expertise (Darrow, 1986; Pursell, 2003).
- Challenges in Engineering Education
2.1. Funding.
This is the main challenge in engineering education capacity building. UNESCO recommends allocating 26% of the annual budget to education, but most countries, especially in Africa, do not even approach this figure in their annual allocation to education. The underfunding affects engineering training and is evidenced by poorly equipped laboratories, inadequate library stocks, poor salaries, low staff morale, and brain drain. (African Human Development, 2006). The inadequacy of teaching and research facilities has contributed to the diminution of the quality of engineering graduates. Many universities across the African region are inadequately staffed both qualitatively and quantitatively. As noted by Njunwa (2008), the goal of human resource development is to promote industrialization in a country in order to achieve economic growth and development.
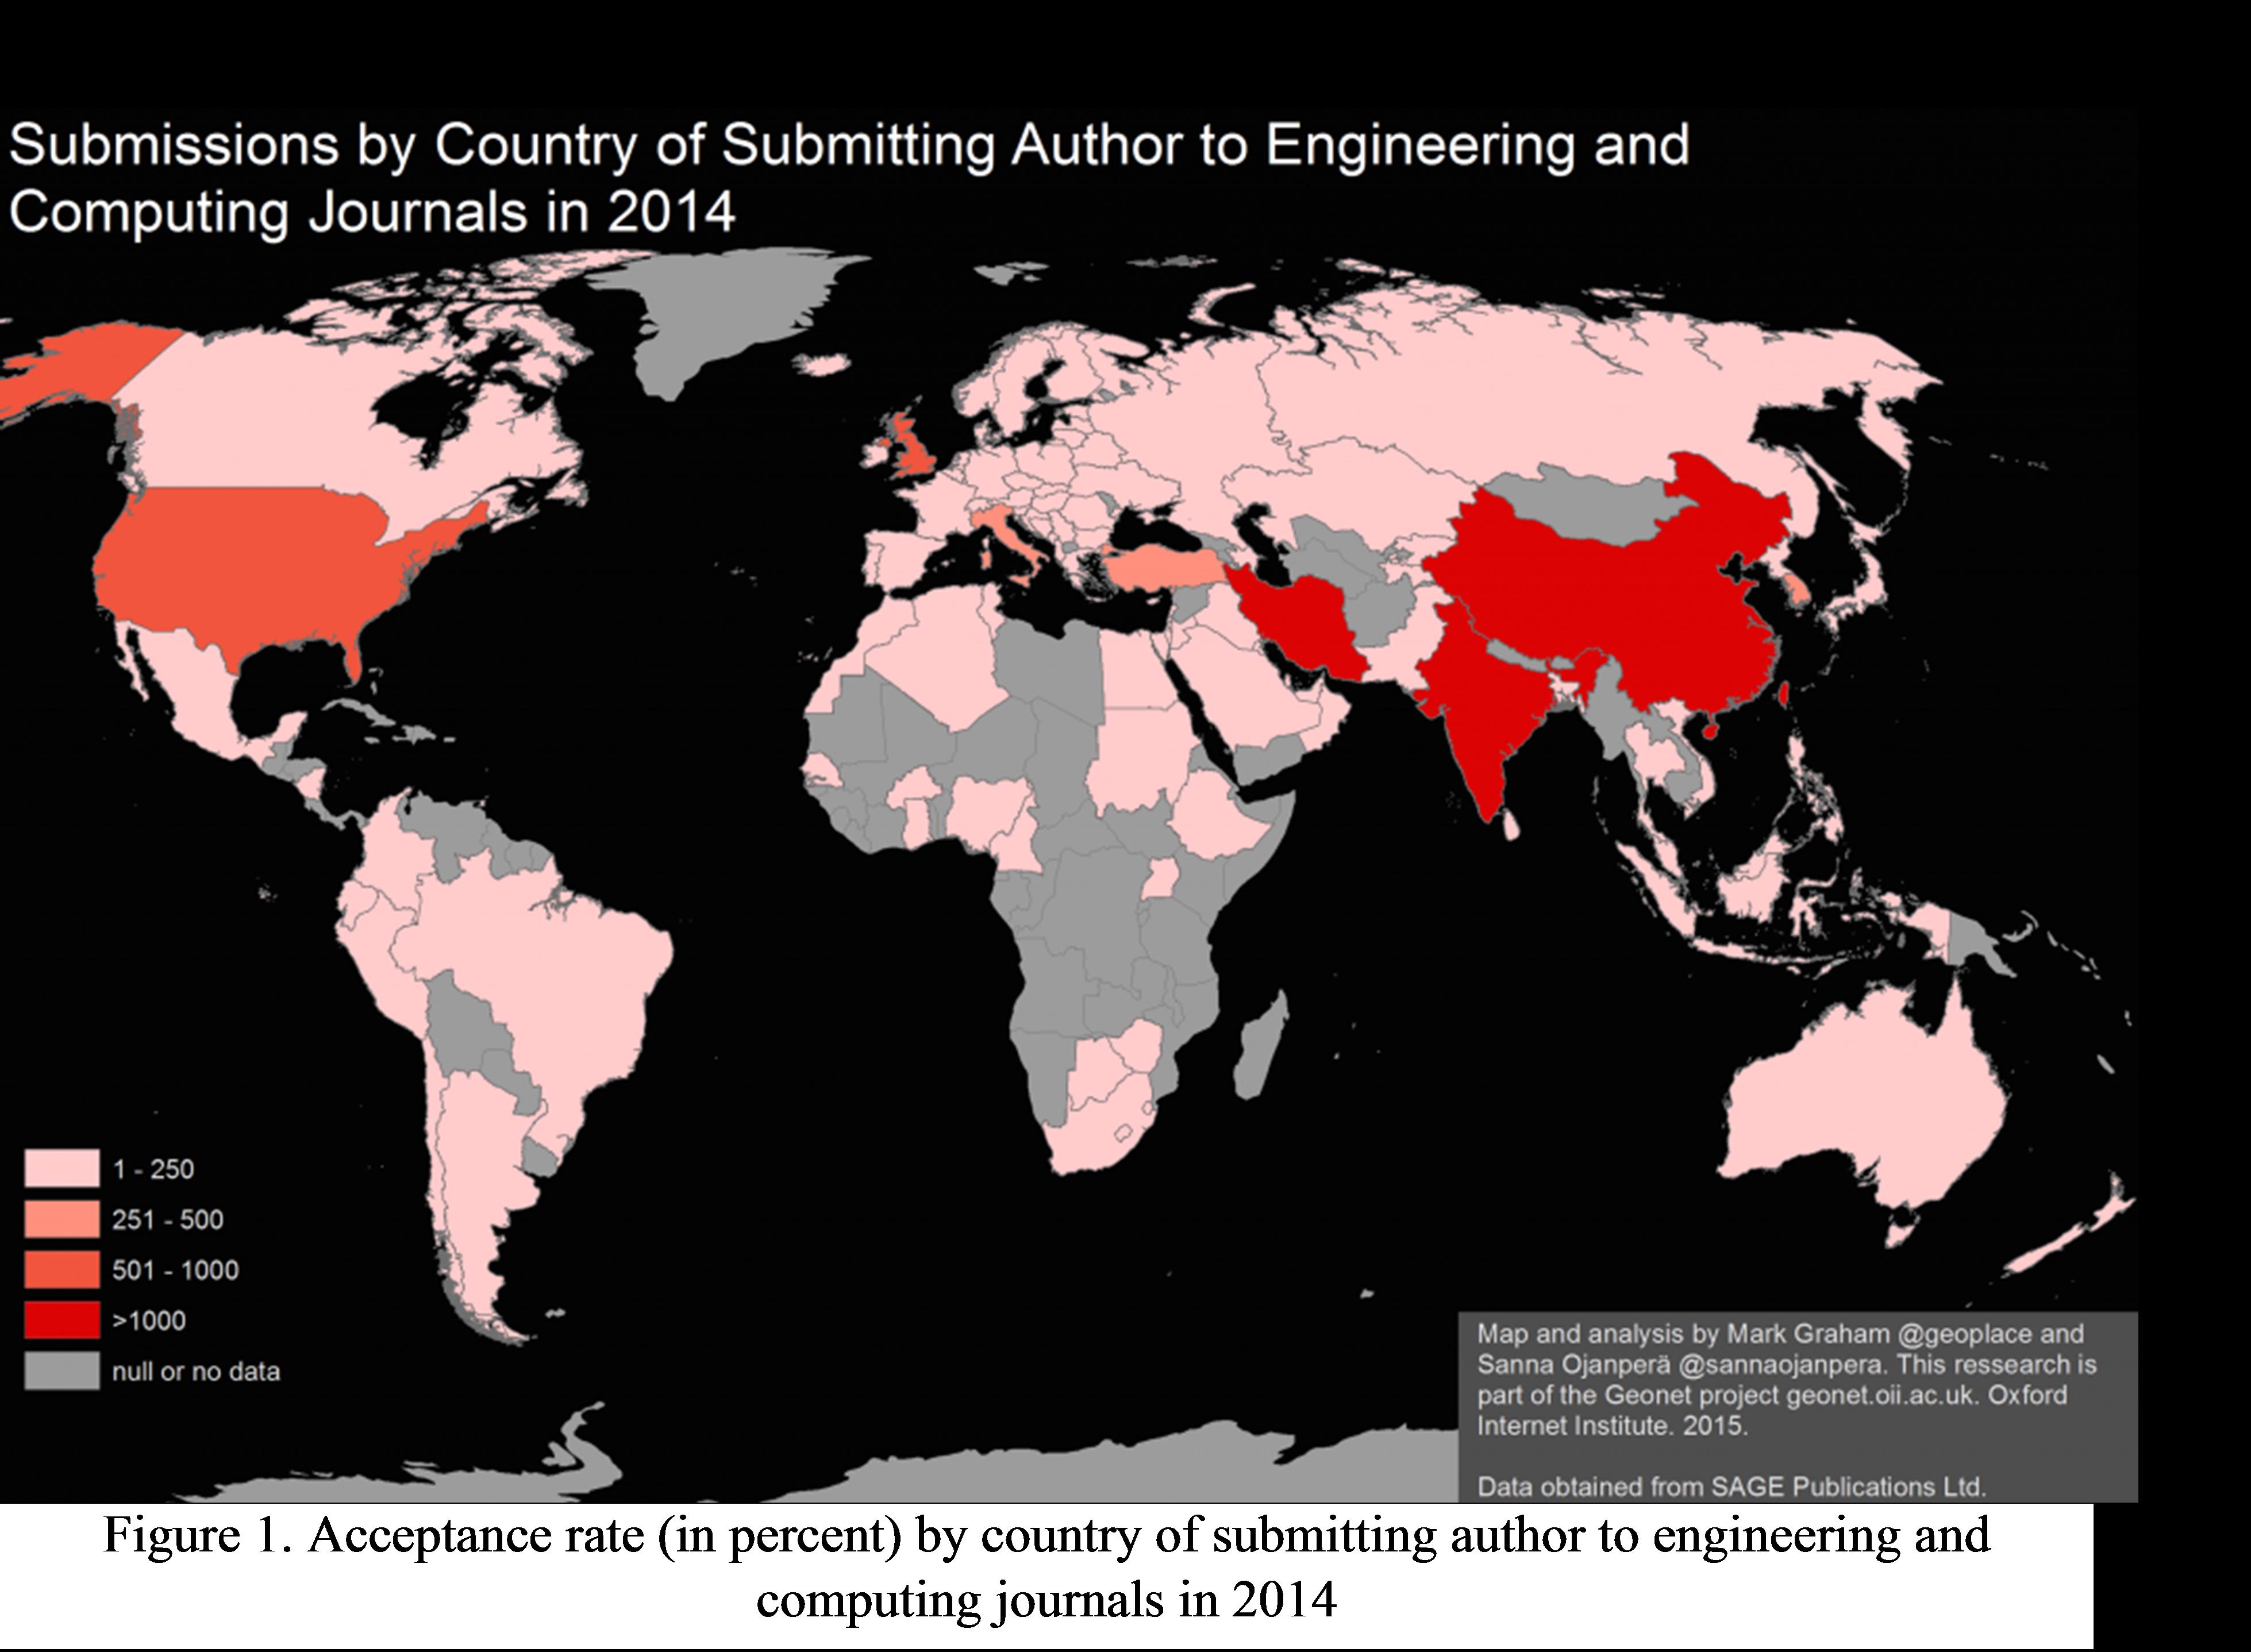
Further, brain drain has contributed to inadequate capacity building efforts in Africa. The government generally dictates funding, and if those in leadership do not have skin in the game, low support for engineering capacity development is expected. Funding in engineering research can as well be manifested by the level of research output. Figure 1 illustrates this, countries that are said to have high output per worker have the highest submission of research papers to engineering and computing journals.
2.2 Poor Infrastructure
There are few reputable engineering and technology training institutions in Africa. Basic resources such as affordable water and energy are still in a poor state in many research institutes in developing countries. The staff at these institutions also earn low salaries compared with other developed regions of the world. For national development, utilization of research and innovation is key. Countries that fail to invest in research and innovation will have stunted growth (UNESCO, 2013).
2.3 Weak University-Industry Partnership
In countries with low output per worker or low engineering capacity development, the industry leaders are rarely involved in defining research agendas. They also rarely participate in the development of engineering curricula to allow them to integrate into the curricula the areas of need of the industry. As a result, the two sectors operate at different levels with different agendas. This is a major setback to properly aligning industry needs with what students are taught in the classroom (Falade and Ibidapo-Obe, 2005). In developed countries, this is not the case. In fact, some countries such as Germany and Switzerland have very strong University-Industry linkages that sometimes ensure participation of up to 40% of the industry in well-structured apprenticeships and research collaborations. It is not unusual to have the industry fund engineering postgraduate students and researchers to carry on research that directly benefits the industry.
The partnership between universities and industry must be strengthened. Otherwise, the development will continue to elude developing nations. The industry must have skin in the game and demonstrate a willingness to collaborate with research institutions.
2.4 Political Will
In countries where the rulers have no skin in the game, that is, no commitment to development and not enthusiastic about addressing those factors that could lead to its realization; they generally lag in engineering training and education. Such rulers do not personally suffer the consequences of their decisions. Education, including engineering education, gets neglected. Engineering players have the difficult, though not impossible, the task of convincing lawmakers why they should give priority to engineering when allocating resources. To achieve positive results, it is advocated to lobby for the participation of engineers in government since they naturally have skin in the game. The government must provide an enabling environment for both university and industry to operate and also fund engineering research projects (Falade, 2010).
The governments must also provide incentives (through policies) that encourage productive activities such as the accumulation of skills and the development of new goods and production techniques. This is the case in countries with high output per worker. Those who flout the policies and engage in corruption face the rule of law. They suffer the consequences for their actions or inactions. In countries with low output per worker, the involved governments generally provide incentives that encourage predatory behaviour such as rent-seeking, corruption, and theft (Hall and Jones, 2002). At lower levels, rent-seeking involves spending time and resources seeking government employment, while at higher levels, people spend their efforts influencing the government via lobbying legislatures and agencies to provide benefits to their clients (Hall and Jones, 2002).
- Data and Case Studies.
Data used in this paper was obtained from the Penn World Table (PWT) 9.1. The PWT is one of the core sources for reliable data that can aid in the study of economic growth and development, as well as understanding the causes and consequences of productivity differences across countries. It provides data on the gross domestic product (GDP) at purchasing power parity (PPP), measures of relative levels of income, output, inputs, and productivity with country and period coverage depending on the release. The first PWT, PWT 5.6, includes 152 countries and territories for the period 1950-1992. The latest PWT is the PWT 9.1, which covers 182 countries between 1950 and 2017.
The main purpose is to compare the output per worker over the years relative to the United States. Observations are then made in relation to these countries observed OPW and their respective engineering education systems. These case studies call attention to the visible relation education, particularly engineering training and output per worker. Countries with poor education and poor policies will be unable to achieve levels of output per worker anywhere near the norms of Western Europe, northern America and eastern Asia. We manage to show how the countries that have high engineering research output tend to also have high output per worker.
Graphical plots were plotted for data available from the year 1963 to 2017. We compare the output per country from 1963 when Kenya got
independence. Several countries such as South Korea, Singapore had the same economic output then, in 1963, but over the years, they have overtaken other countries such as Kenya.
The data to be analyzed and compared is for these select countries: Kenya, South Africa, South Korea, Singapore, Malaysia, Germany, the USA and the UK. To make the comparisons easier, all terms are expressed as ratios to U. S. values.

In 1963, output per worker in the United States was 12 times higher than output per worker in Kenya. In just over 30 days, the average worker in the United States produced as much as an average worker in Kenya produced in an entire year. In the same year, output per worker in the United States was ten times higher than output per worker in South Korea. In just over 37 days, the average worker in the United States produced as much as an average worker in South Korea produced in an entire year.

In 2013, 50 years later, output per worker in the United States was 15 times higher than output per worker in Kenya. That is to say, in just over 24 days, the average worker in the United States produced as much as an average worker in Kenya produced in an entire year. In the same year, output per worker in the United States was 1.7 times higher than output per worker in South Korea. In just over 214 days, the average worker in the United States produced as much as an average worker in South Korea produced in an entire year. The same case applies to Singapore, China and all the countries shown in the table. Their output per worker for Kenya decreased drastically over the same period of time. Explain such a vast difference in economic performance is a fundamental challenge in economics. Many factors have been considered before to explain such differences in the economic performances of different countries. Differences among countries can be attributed to differences in human capital, physical capital, and productivity.
2017 World Bank Group’s TCdata360 (World Economic Forum, 2017) on “Availability of scientists and engineers” ranks Kenya position 41 out of 137, Singapore is ranked position 9, South Korea is ranked position 38, South Africa is ranked 100, China is ranked position 29 out of 137. Switzerland is ranked number 12 out of 137 countries.
The Human Capital Index (HCI) index measures the amount of human capital that a child born today can expect to attain by age 18, given the risks of poor health and poor education that prevail in the country where she lives. It is designed to highlight how improvements in current health and education outcomes shape the productivity of the next generation of workers, assuming that children born today experience over the next 18 years the educational opportunities and health risks that children in this age range currently face. For all the countries considered, the HCI seems to have been increasing over the years except for some countries such Switzerland. Singapore has made a huge improvement from 0.538 in 1963 to 1.063 in 2017.

Kenya’s output per worker (against USD) was highest in 1951(at 0.104), more than a decade before Kenya got independence. It was lowest in 2004 (at 0.048). The output per worker has since risen steadily though it is still very low. It could be noted that corruption and mismanagement of resources are leading to this trend. The pervasive use of expatriates could also be responsible for this. According to the Global Competitiveness Report 2017-2018(World Economic Forum, 2017), Kenya ranked number 91 out of the 137 countries. It was ranked number 97 on the Higher education and training pillar, number 37 on the Innovation pillar and number 88 on Technological readiness. Kenya ranked number 44 on the extent of staff training, number 61 on quality of math and science education, number 32 on University-industry collaboration in R&D, number 41 on availability of scientists and engineers, number 38 on the capacity for innovation, and 45 on quality of scientific research institutions.
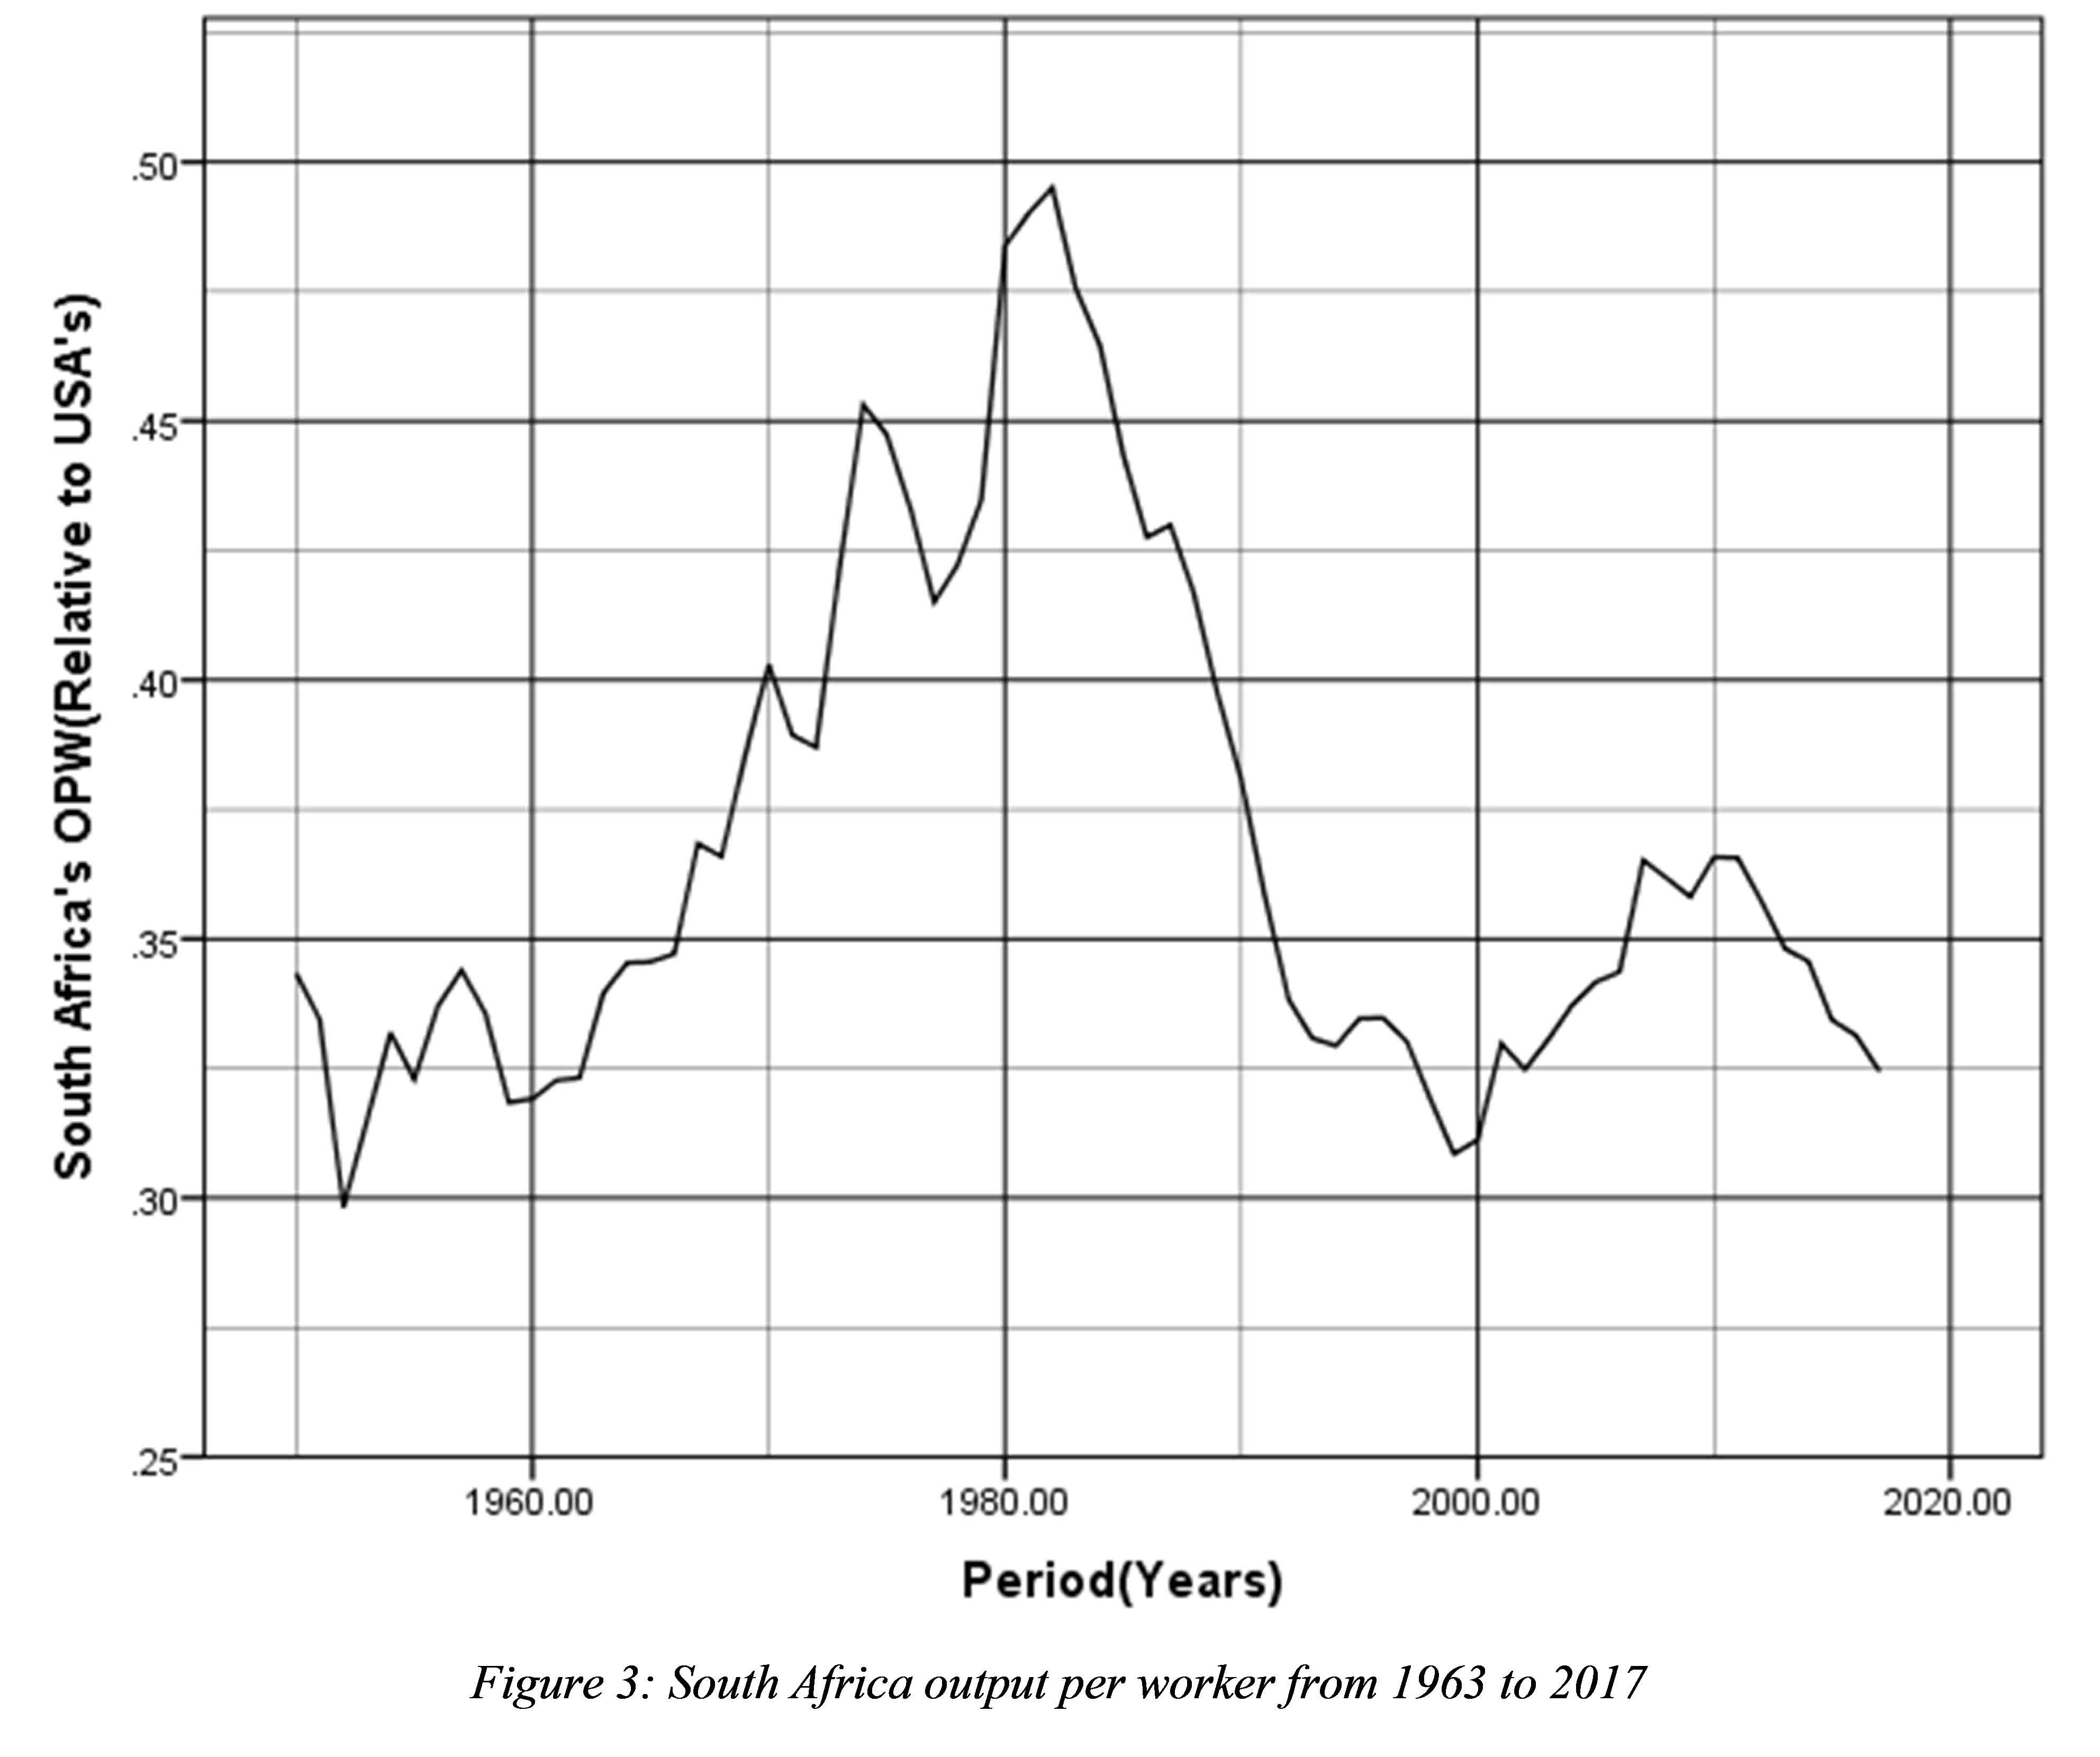
According to the same report, the main problematic factors for doing business were Corruption (19.1%), Access to financing (15.5%), and inadequate supply of infrastructure (9.3%). Covering 137 economies, the Global Competitiveness Index 2017–2018 measures national competitiveness—defined as the set of institutions, policies and factors that determine the level of productivity. As shown in figure 3, South Africa’s output per worker was highest in 1982 (0.495) and lowest in 1952(0.298), and it seems to be in decline when compared relative to the USA dollar. According to the Global Competitiveness Report 2017-2018 (World Economic Forum, 2017), South Africa ranked number 61st and remains one of the most competitive countries in sub-Saharan Africa, and among the region’s most innovative (rank number 39th). South Africa ranked number 39 on the extent of staff training, number 128 on quality of math and science education, number 29 on University-industry collaboration in R&D, number 100 on availability of scientists and engineers, number 30 on the capacity for innovation, and number 42 on quality of scientific research institutions.
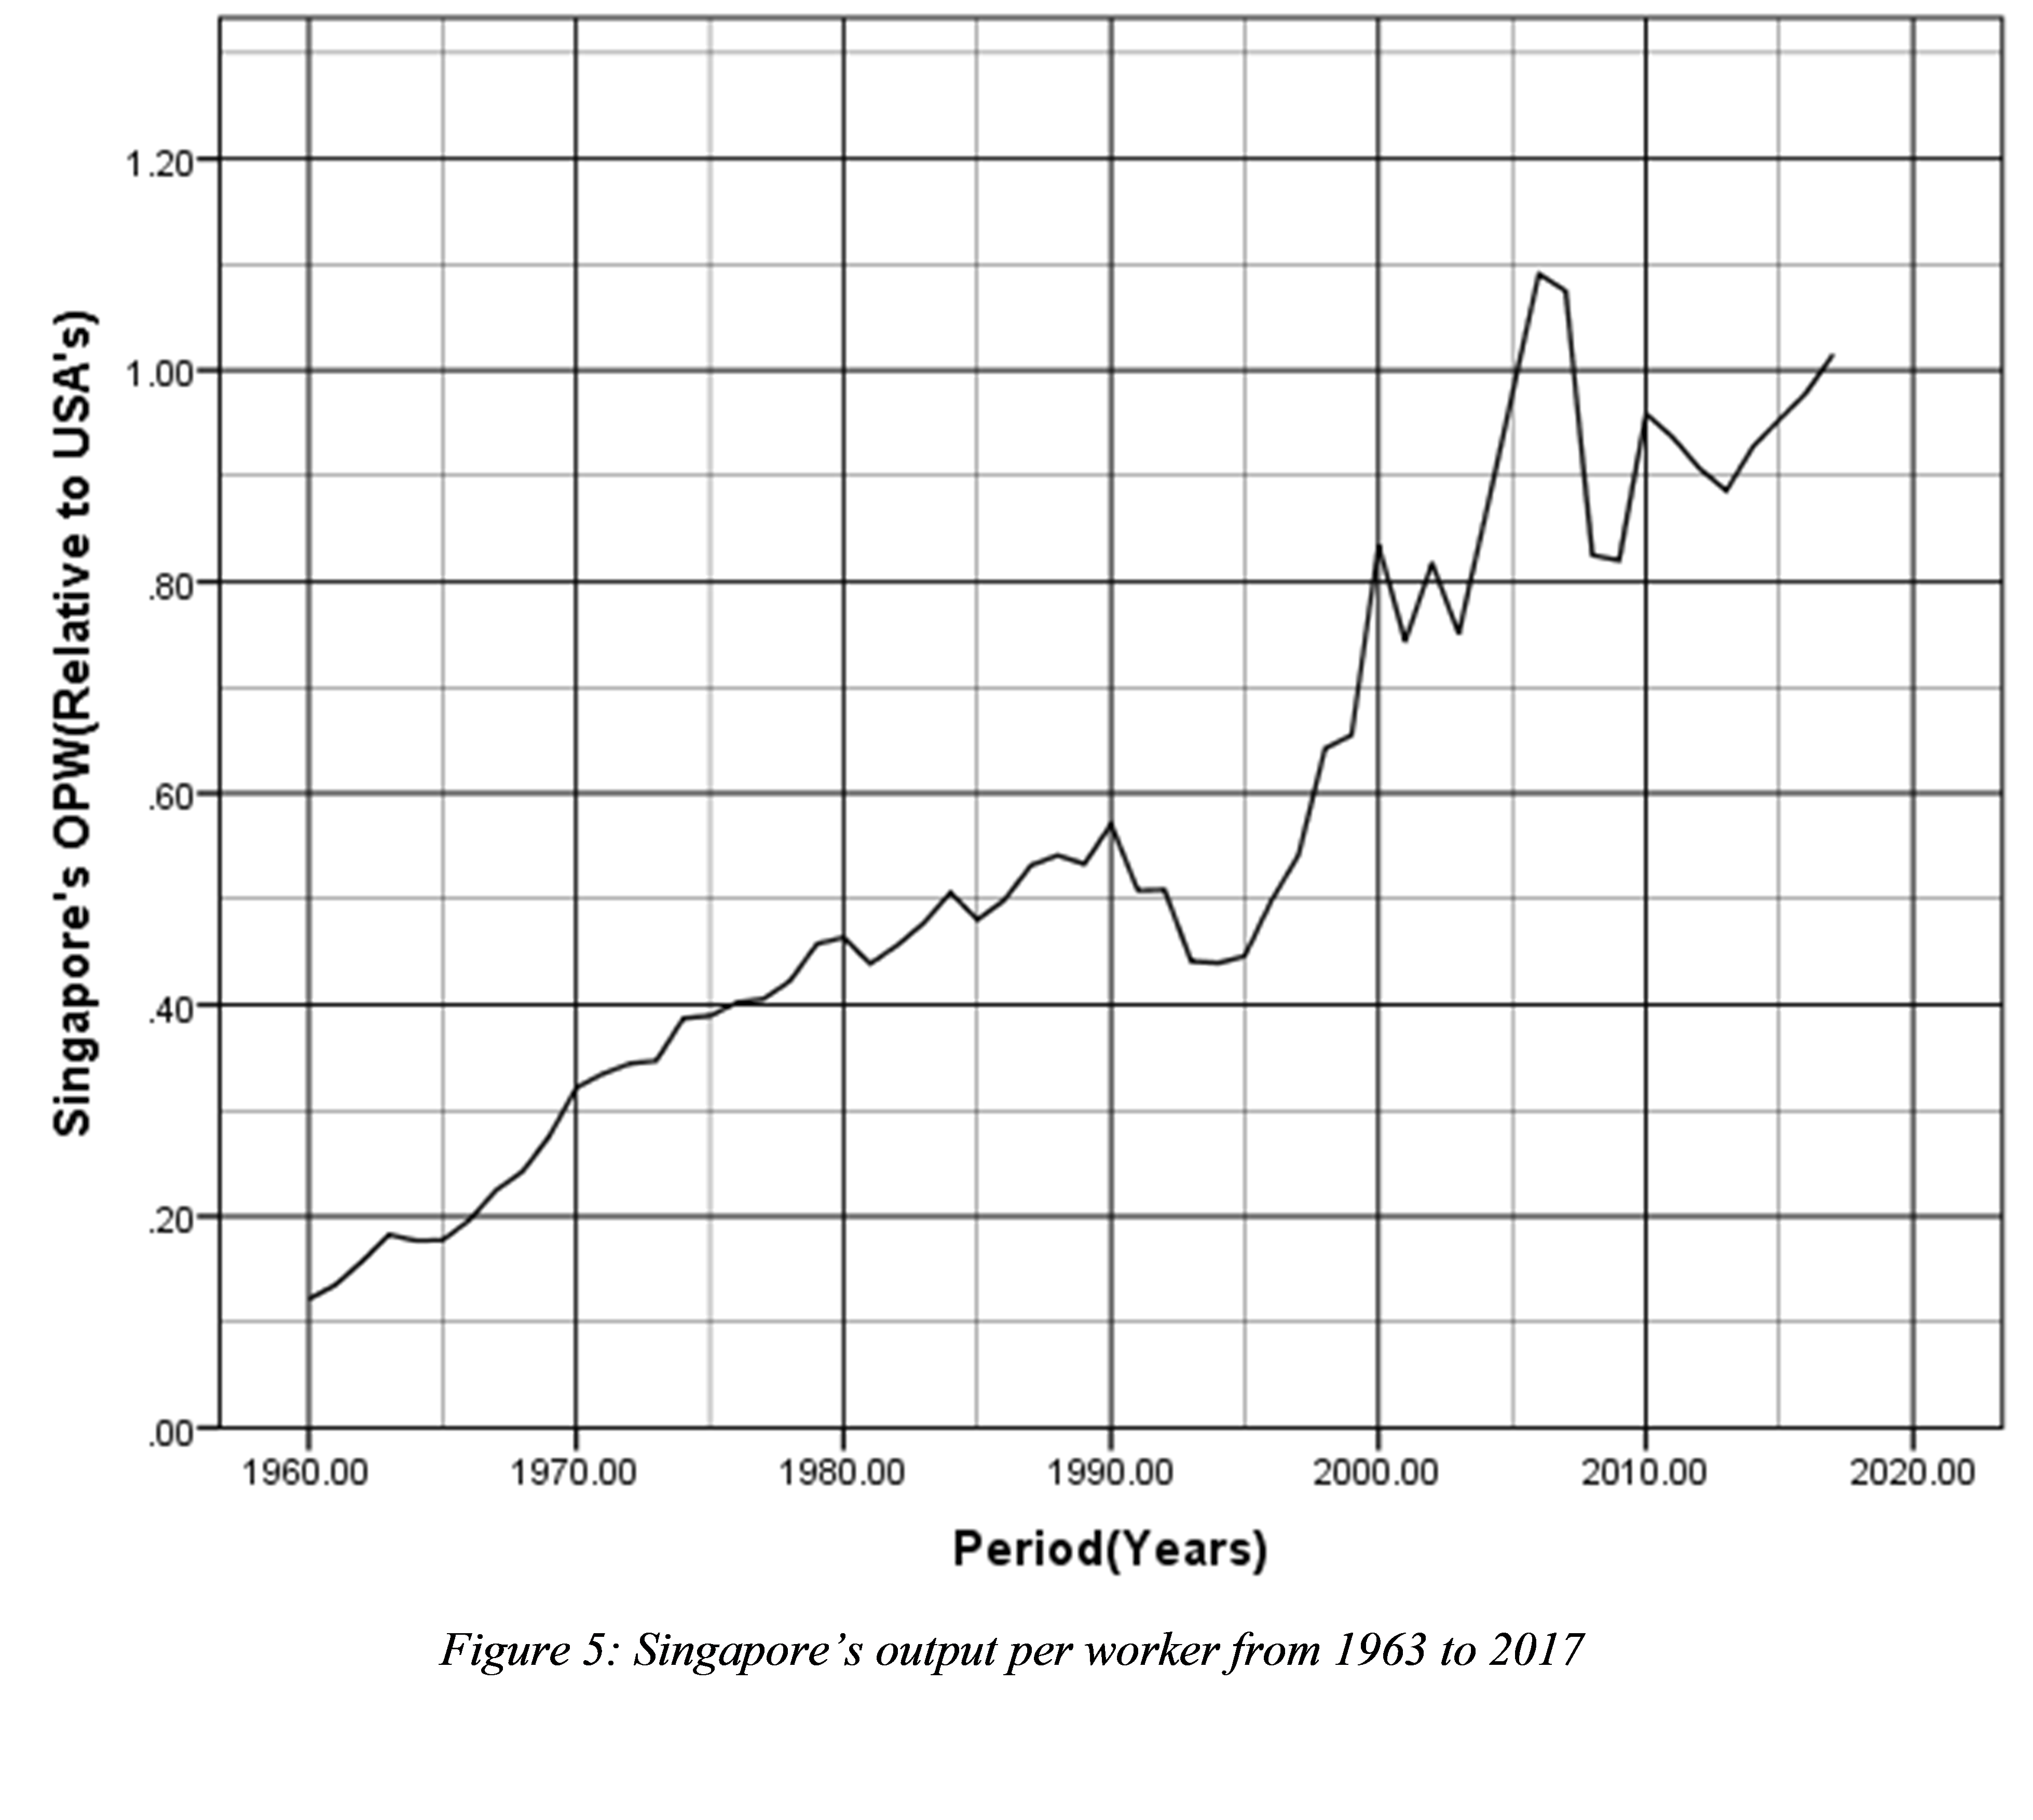
As shown in figure 4, South Korea’s output per worker was highest in 2017 (0.621) and lowest in 1953 (0.089), and it seems to be in decline when compared relative to the USA dollar. According to the “Global Competitiveness Index 2017-2018”, South Korea was ranked number 27 was eight times the output per worker in Singapore. Forty-six years later, Singapore had managed to close the output per worker gap. According to the Global Competitiveness Index 2017-2018, Singapore ranked number 3 out of 173. Singapore ranked number one out of 137 countries on the Higher education and training pillar, number 9 on innovation pillar and number, number 14 Technological readiness, and number 2 on infrastructure. On Quality of math and science education, it ranked number 1.

As shown in Figure 6, China’s output per worker was highest in 2017 (0.196) and lowest in 1961 (0.044), and it seems to be in decline when compared relative to the USA dollar. In 1960, the output of a worker in the United States was twenty-three times the output per worker in China. Fifty-six years later, the output of a worker in the United States was five times the output per worker in China. This is an increase in productivity by 1800% over the 56 years.
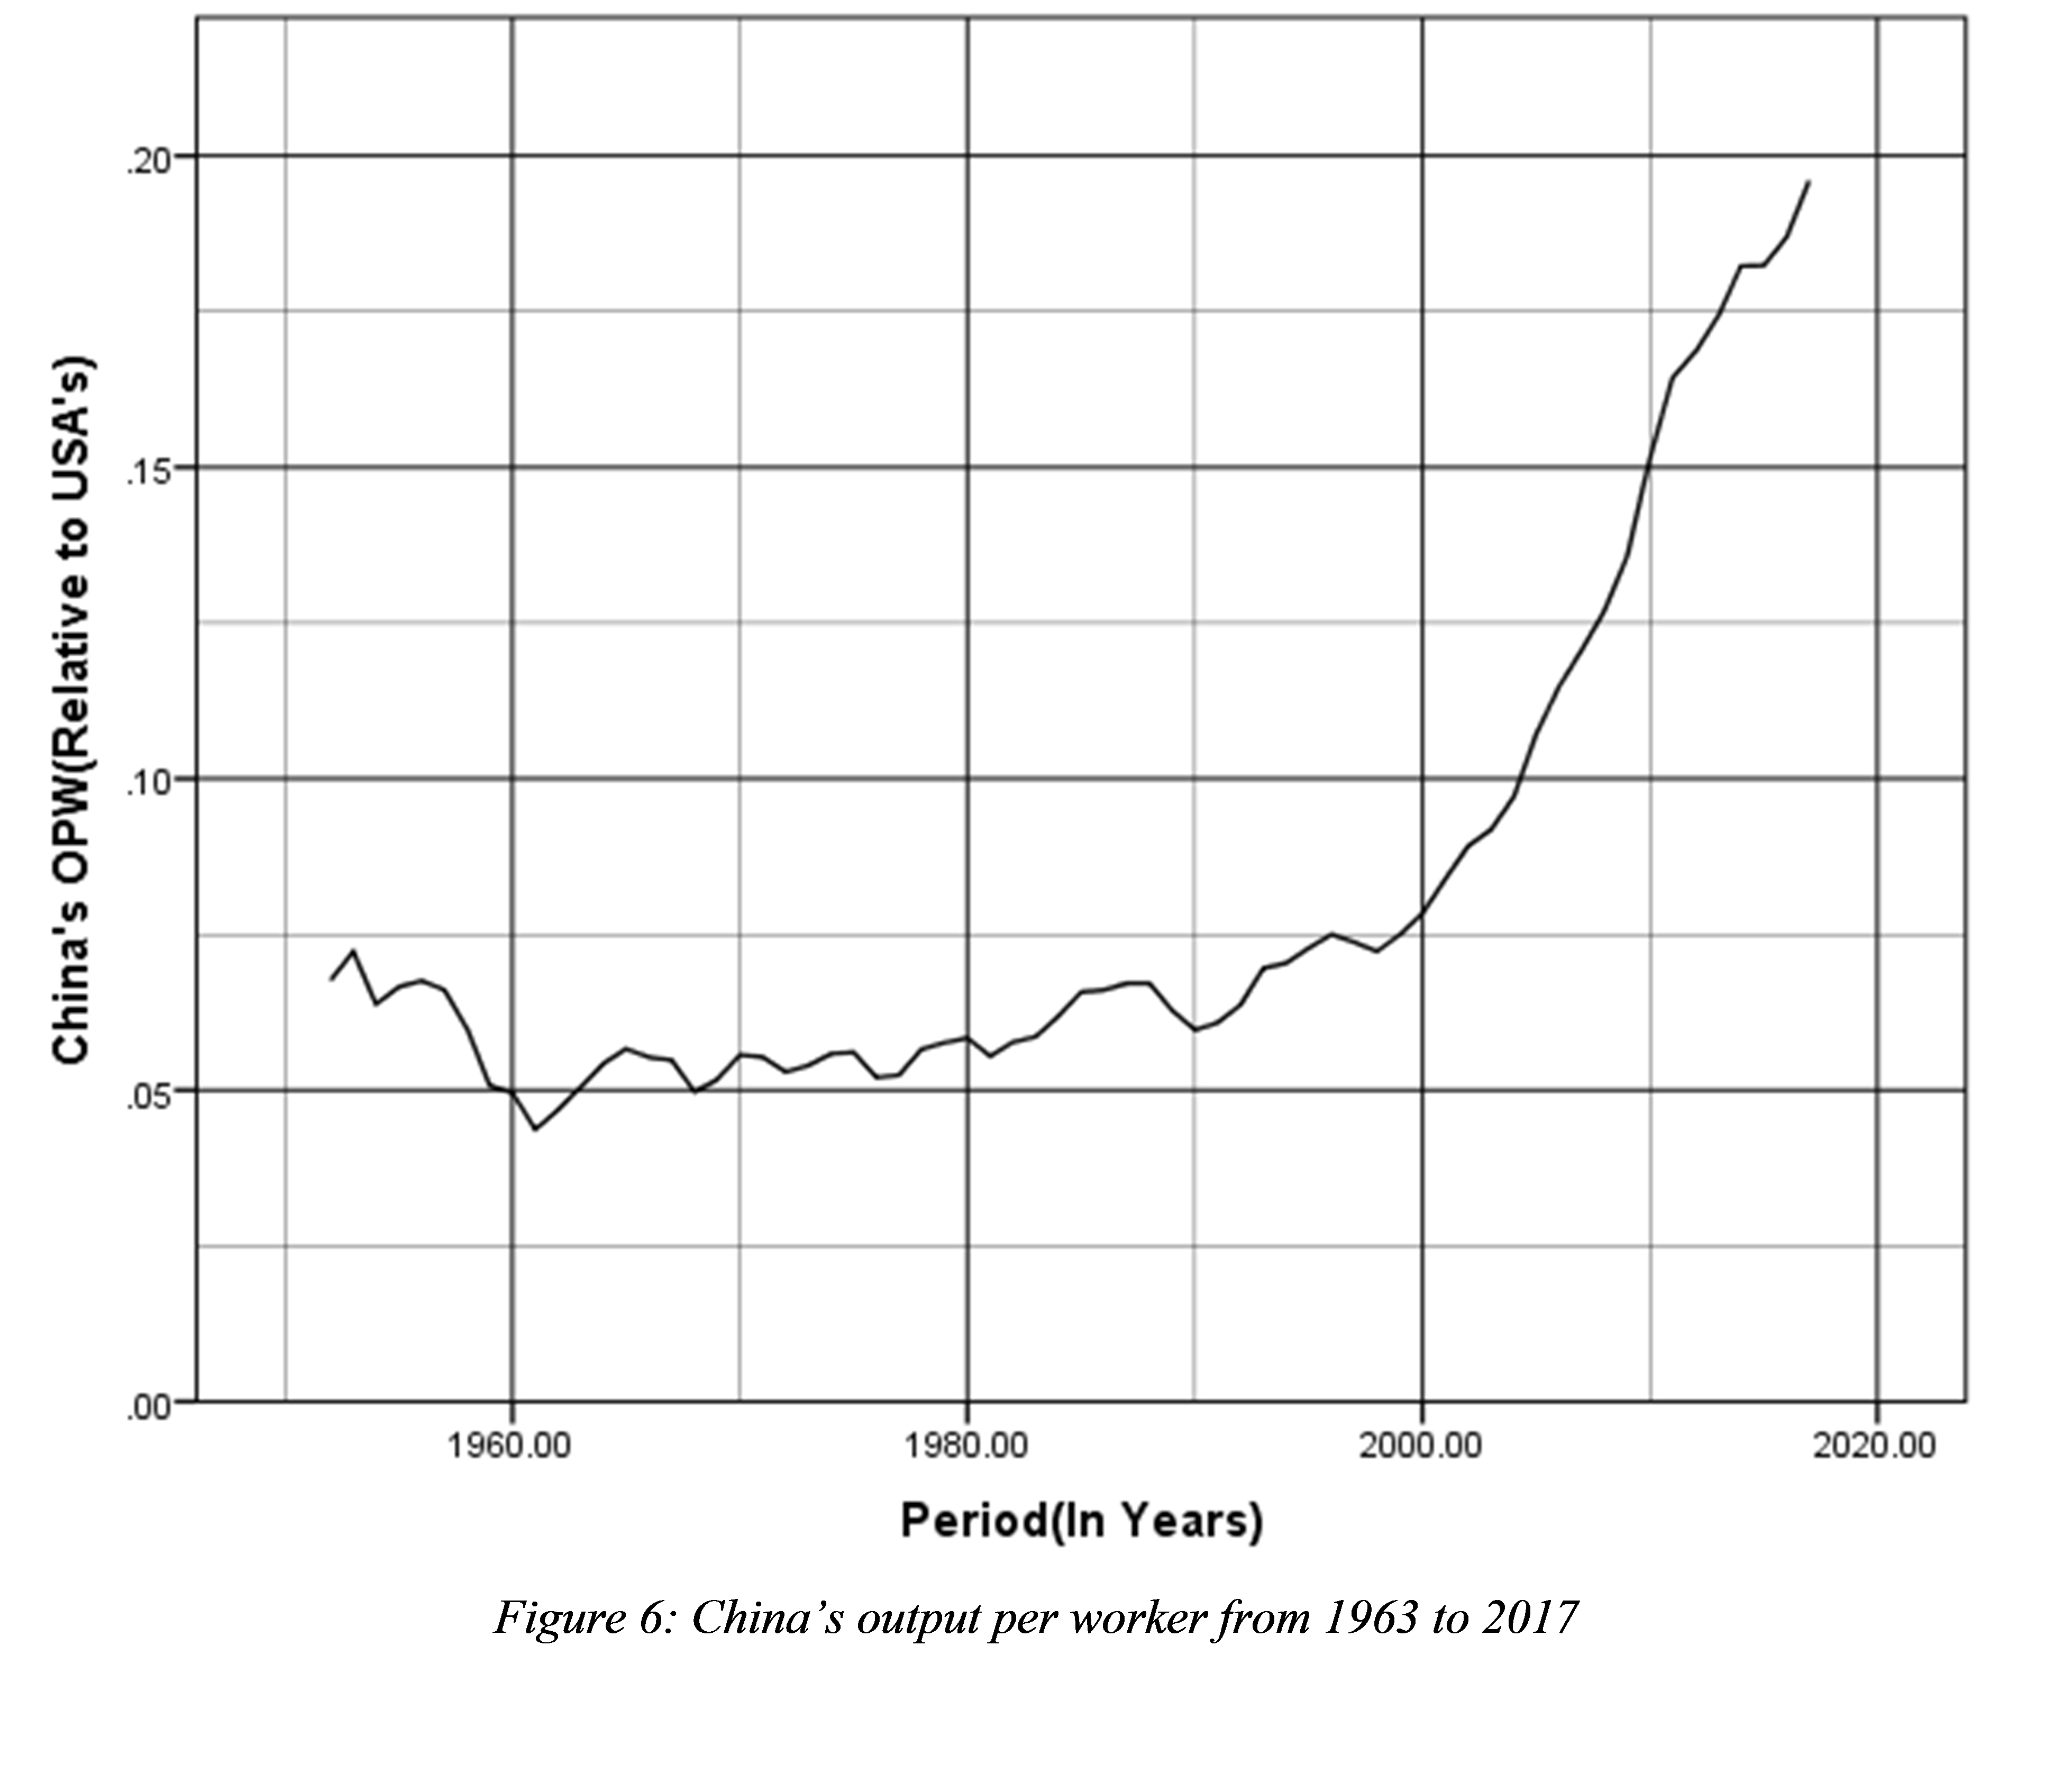
According to the Global Competitiveness Index 2017-2018, China ranked number 27 out of 137 countries. It was ranked number 47 on Higher education and training, number 28 on Innovation, number 27 on Technological readiness. It ranked number 50 on Quality of math and science education and number 37 on Extent of staff training.
Differences in physical capital and education, especially engineering training and attainment, can perhaps explain the variation in output per worker.
Switzerland’s Human Capital Index (HC) has consistently been greater than the USA’s. Here is how their education is structured: This may explain the high HC and OPW.
The link between the countries education system and economic development cannot be ignored.
Consider Switzerland. Switzerland is an engineering powerhouse. Its focus on hands-on engineering training is also legendary. The Swiss Apprenticeship Model (Singmaster, 2015) is an Employer Driven System of Education & Training. About 97% of all students have graduated with a VET Diploma (Vocational Education & Training) or other high school degrees. Some statistics about Switzerland Engineering/Vocational Training:
- 6% unemployment rate (Wurz, 2019).
- 612 million Population.
- 580,000 businesses.
- 70% of all students choose apprenticeships, no stigma – most CEO’s have been apprentices.
- 40% of companies participate in the program.
According to the Global Competitiveness Index 2017-2018, Switzerland ranked number 1 out of 173 countries. It was ranked number 5 on Higher education and training, number 2 on Technological readiness, number 1 on Innovation, and number 6 on Infrastructure. It ranked number 3 on Quality of math and science education, number 1 on Quality of the education system and number 1 Extent of staff training.
As seen from the graphs. South Africa’s output per worker has remained high over the years. South Africa higher education structure is very different from Kenya’s. Concerning engineering education and training, there is a very strong industrial linkage (World Economic Forum, 2017). It is not uncommon to have businesses fund students and professionals to pursue MSc and PhD research in areas that are useful to the specific company. For example, ESKOM, South Africa’s Power Utility Company, regularly funds research that eventually benefits the company and the country.
South Africa also has an engineering council that is established by the law. This council is mandated with regulating engineering education, training in South Africa. When it comes to registering professional engineers, the council outsources these processes to specific engineering societies. For example, Electrical engineers are registered through the South Africa Institute of Electrical Engineers. Kenya has only one body, the Engineers Board of Kenya, that registers all the engineers. There is also only one engineering society in Kenya, the Institution of Engineers of Kenya (IEK).
South Africa is also a member of the Washington Accord and international accord and membership of engineering associations that ensures that engineers trained in South Africa can practice anywhere in the world. As a result, their credentials are recognized internationally.
Though it could be the case of the proverbial egg and chicken that leads us into asking, is it sound training policies that lead to better-trained engineers who power the economy of the said countries, or it is the opposite?. Who makes the engineering policies? Do they suffer the consequences of their actions? In other worlds. Do they have skin in the game?
Germany is a renowned engineering powerhouse. Its engineering education system stresses hugely on apprenticeship (Lucena and Schneider, 2008). Many of the global engineering companies have their headquarters in Germany. Germany has a dual apprenticeship system. They are also exporting this system to other countries. Germany has always been at the forefront of cutting-edge research. German universities and centres of research have always worked closely with companies and industries and developed close symbiotic and strategic relationships. This gives students exciting opportunities to use the skills they learn in Engineering courses in real-life scenarios to solve real problems (Unwin, 1996). The Technical University of Munich, for instance, has partnerships with famous companies like Siemens and General Electric, BMW and also offer students the possibility to work on research projects in collaboration with local research centres like the Max Planck Institutes and Deutsches Museum.
Germany is known for its dual vocational education and training system, in which apprentices train in a specific company while enrolling in a public vocational school (Lucena and Schneider, 2008). Many credit Germany’s apprenticeship programs for being a key factor in the country’s relatively low youth unemployment rate.
Countries with the highest output per worker also happen to have the most robust engineering education and research. The highest performing universities also happen to be from the same countries. This means these countries are engaging in cutting-edge engineering research. Research acts to stimulate innovation, with improved innovation leading to the creation of new goods and services. This, in turn, stimulates economic growth and development within countries.
Using the Times Higher Education World University Rankings (“World University Rankings 2019 by subject: engineering and technology”, 2019), we investigated countries with engineering and technology departments that rank within the top 100 in 2019. All the countries with high output per worker performed well based on this measure. For example, the USA had 37 engineering departments in the top 100, of which ten were in the top twenty.
Other countries that had their engineering and technology departments in the top 100 included: United Kingdom (8), Singapore (2), Switzerland (2), China (9), Netherlands (2), Hong Kong (9), Germany (7), Canada (3), South Korea (5), Japan (5), Belgium (1), Sweden (2), Australia (7), Denmark (2), France (2), Taiwan (1), India(1).
The universities with engineering and technology departments ranked within the top
One hundred are mostly from developed countries, with very high output per worker. Thus, while emerging countries are often drawing high numbers of students to study engineering, the quality of their engineering departments appear to lag behind those of developed nations.
The economic theory highlights the importance of accumulating research and design and human capital to support growth. It acts to increase productivity and output as well as stimulating innovation. Countries with low output per worker spend a smaller proportion of GDP on R&D relative to those with high output per worker. Thus, even at macro levels, societies that have skin in the game generally invest in the development of their engineers and research capacity. They reap the positive consequences. This essentially becomes a never-ending feedback loop with increasing positive returns at the national level. These countries commit relatively large amounts of resources in R&D spending, and as a result, they are well placed to lead new engineering discoveries and innovations. Examples are all the countries with engineering and technology departments in the top 100, 2019 Times Higher Education World University Rankings mentioned above.
Research and Development is an activity that aims to better understand problems, find new and innovative solutions, create new goods, services or management systems. Firms have to stay up to date with modern developments, develop new production techniques and constantly improve production methods. This can, in turn, increase profitability and growth.
- Conclusion
This paper aims to call attention to the relation between engineering education or training in general and output per worker. The countries that have invested heavily in science and engineering have also witnessed a corresponding increase in output per worker.
The paper’s contribution was to show, heuristically, and using case studies, how important investment is in quality engineering education to a country’s productivity. We are aware that feedback may occur from output per worker to engineering education training. There could be a feedback loop, but tracking the output per worker for countries such as Singapore shows that deliberate education and economic policies have a huge influence on a country’s economy. A major milestone in recent education reforms in Singapore is the “Thinking Schools, Learning Nation” (TSLN) vision that provides direction to the transformation in the education system since 1997(Ng, 2007). Thinking Schools is a vision of a school system that can develop creative thinking skills, lifelong learning passion and nationalistic commitment in the young. There are many other major education policies in Singapore that have had a huge impact on the countries education system and economy. The political leaders and policymakers have skin in the game as they are held accountable by the citizens.
When policymakers and institutions are held accountable, they will draft and implement policies that will serve the public and the country as a whole (Hall and Jones, 1999). If they do not have skin in the game, if they have nothing to lose, then the reverse is true. Countries that have heavily invested in the education of their citizens, especially mathematics and science education, seem to have very high output per worker.
- Recommendations
- Engineering lecturers should be persuaded to have skin in the game. Just like it is usual for medical and law students to be taught by licensed practitioners, especially in their senior years, the same should be required of the engineering lecturers in developing countries.
- To hold lecturers accountable to their students and the public, a national anonymous rating system or platform could be developed so that lecturers could be rated anonymously on select parameters. The ratings would be done by their respective students. These ratings would be publicly accessible.
- Universities should develop new standards for lecturer qualifications, appointments, and expectations. For example, an engineering lecturer may be required to have experience as a practicing engineer. Students should also be taught how to learn, and lifelong learning ought to be facilitated.
- The government and the universities should seriously consider funding research in the universities and do so with merit. For example, there should be a fund set aside to fund and reward researchers or lecturers who publish in highly reviewed academic journals and fund and offer conference grants to students and lecturers who present their work in highly visible conferences. This will ensure the visibility of research output by the universities. It will also act as an incentive to motivate researchers in the engineering sector. The South African government has adopted this model. It could be one of the main reasons South African universities have remained perennially at the top 10 universities in Africa for decades.
- Developing countries should adopt the apprentice model that proves to be a success in countries such as Germany and Switzerland (Kingombe, 2011).
- There should be an act or policy that requires technology transfer from foreign firms that work in the country. In addition, a condition for engaging in huge infrastructure projects should be that the foreign companies must proactively teach local talent and willingly expose engineering graduates to such works. This is how things worked in South Korea.
- Developing countries should adopt project’s centred curriculum. Assessment of the professional skills through the projects, undertaken by interview and other interactive methods. This can easily be done through an online assessment supported by pen and paper tests as required (UNESCO, 2013).
- The industry (Engineering employers) and engineering departments in universities should be encouraged to collaborate and build more effective partnerships. In addition, they should engage in a well-organized strategy and effort to promote public understanding of engineering and technology literacy of the public (UNESCO, 2013).
- The essence of engineering- the process of designing, predicting performance, building, and testing should be taught from the earliest stages of the curriculum (National Academy of Engineering, 2005).
- The professional engineering organizations should assist in developing an enhanced understanding in the community of the engineering profession and the roles performed by engineers, and promote engineering as an exciting, important and rewarding career to girls and boys in secondary school (National Academy of Engineering, 2005).
- Industry professionals could be involved in teaching a part of the curriculum to ensure students are ready for the industry when they graduate and to bring in new thought processes. We need to have ‘professors or lecturers of practice.’ The industry and academia can join hands and make joint appointments for a 50-50 work arrangement. Such a professional would be shared between the industry and the academia.
References
Africa Human Development Department (2006) ‘Nigeria Science and Technology Education at Post-Basic Level (STEP B) – Review of Science and Technology Education in Federally-Funded Institutions’ Nigeria Country Office, Nigeria.
Darrow, K. and Saxenian, M., 1986. Appropriate technology sourcebook: a guide to practical books for the village and small community technology. Stanford: A Volunteers in Asia Publication.
Downey, G.L. and Lucena, J.C., 2004. Knowledge and professional identity in engineering: code-switching and the metrics of progress. History and Technology, 20 (4), 393–420.
Downey, G.L. and Lucena, J.C., 2005. National identities in multinational worlds: engineers and ‘engineering cultures’. International Journal of Continuing Engineering Education and Lifelong Learning, 15 (3/4), 252–260.
Falade F. and Ibidapo-Obe (2005), ‘Effective University/Industry Partnership: A Tool for Sustainable Development’ Proceedings of 1st African Regional Conference of Vice-chancellors, Provosts and Deans
of Science, Engineering and Technology, Accra Ghana 15th – 17th November 2005, pp 305 – 314
Falade F. (2010), ‘Engineering Education: Bedrock of Industrialization’, Proceedings of a 3-Day International Workshop on Engineering Education in Nigeria: Innovative Teaching and Learning Tools organized by Council for the Regulation of Engineering in Nigeria (COREN) at Rockview Hotel, Abuja, 5th – 7th October 2010.
Hall, R. E., Jones, C. I. 1999. Why do some countries produce so much more output per
worker than others? Quarterly Journal of Economics, 114(1), 83-116.
- Lucena & J. Schneider (2008) Engineers, development, and engineering education: From national to sustainable community development, European Journal of Engineering Education, 33:3, 247-257, DOI: 10.1080/03043790802088368
Kingombe, C. (2011). Lessons for Developing Countries from Experience with Technical and Vocational Education and Training (pp. 98-99). London: International Growth Centre. Retrieved from https://www.theigc.org/publication/lessons-for-developing-countries-from-experience-with-technical-and-vocational-education-and-training-working-paper/
Lorna Unwin (1996) Employer‐led Realities: apprenticeship past and present,
Journal of Vocational Education and Training, 48:1, 57-68, DOI: 10.1080/0305787960480104
Ng, P. T. (2007). Educational reform in Singapore: From quantity to quality. Educational Research for Policy and Practice, 7(1), 5e15. https://doi.org/10.1007/s10671-007-9042-x.
Royal Academy of Engineering. (2016). Engineering and economic growth: a global view (pp. 4-5). London: Centre for Economics and Business Research Ltd.
Singmaster, H. (2015). An Apprenticeship Model from Switzerland. Retrieved 26 July 2019, from https://asiasociety.org/global-cities-education-network/apprenticeship-model-switzerland
United Nations Educational, Scientific and Cultural Organization (UNESCO). (2013). Engineering Education: Transformation and Innovation (pp. 37-41, 91-115, 165-173, 176-188). Melbourne: RMIT University Press
World Economic Forum. (2017). The Global Competitiveness Report 2017–2018 (pp. 126-127, 166-169,268-269, 278-279,). Geneva: World Economic Forum.
World University Rankings 2019 by subject: engineering and technology. (2019). Retrieved 26 July 2019, from https://www.timeshighereducation.com/world-university-rankings/2019/subject-ranking/engineering-and- IT
Wurz, J. (2019). Swiss unemployment hit a ten-year low in 2018. Retrieved 26 July 2019, from https://www.swissinfo.ch/eng/job-market_swiss-unemployment-hit-ten-year-low-in-2018/44664854