In today’s data-driven world, the ability to analyse information is no longer a niche skill; it is a fundamental part of modern research. But faced with a mountain of data, many researchers find themselves asking a daunting question: “Where do I even begin?”
The key to unlocking the power of your data lies in understanding that analysis is not a single action, but a journey. It’s a process of asking progressively deeper questions to move from raw information to insightful, actionable wisdom.
This guide will walk you through the four essential levels of data analysis. Think of it as a roadmap that starts with understanding the past and ends with shaping the future.
Level 1: Descriptive & Text Analysis – What Happened?
This is the foundation of all data analysis. Before you can understand why something happened, you must first have a clear picture of what happened. This level is about summarising and organising your data to make it understandable.
- Descriptive Analysis focuses on quantitative data, giving you a clear summary of your dataset through measures like mean, median, and standard deviation. It answers basic questions about your numbers.
- Text Analysis does the same for qualitative data. By using techniques like sentiment analysis or topic modeling, you can extract meaningful patterns, themes, and insights from unstructured text like interviews, surveys, or social media comments.
When to Use: This is always your starting point. Use it when you need to summarise survey results, understand the key themes in interview transcripts, or get a clear overview of your raw data.
The Core Question: What are the basic patterns and summaries in my data?
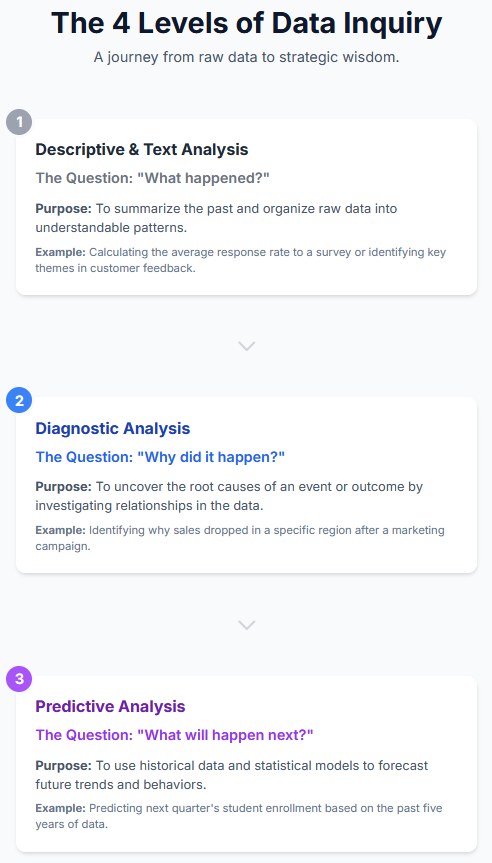
The 4 Levels of Data Inquiry
Step 1: Descriptive & Text Analysis (The Foundation)
- Question: What happened?
- Purpose: To summarise the past and organise raw data.
- Example: Calculating the average response rate to a survey.
Step 2: Diagnostic Analysis (The Investigation)
- Question: Why did it happen?
- Purpose: To uncover the root causes of an event or outcome.
- Example: Identifying why sales dropped in a specific region.
Step 3: Predictive Analysis (The Forecast)
- Question: What will happen next?
- Purpose: To use historical data to forecast future trends.
- Example: Predicting future student enrollment based on past data.
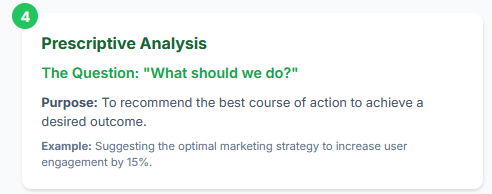
Step 4: Prescriptive Analysis (The Strategy)
- Question: What should we do about it?
- Purpose: To recommend the best course of action to achieve a desired outcome.
- Example: Suggesting the optimal marketing strategy to increase engagement.
Level 2: Diagnostic Analysis – Why Did It Happen?
Once you know what happened, the natural next question is why. Diagnostic analysis is the investigative phase, where you dig deeper into your data to understand the root causes of an event or outcome. This level is about moving from observation to explanation.
Techniques like root cause analysis, hypothesis testing, and correlation analysis help you explore the relationships between different variables and identify the factors that led to a particular result.
When to Use: Use this when you observe an unexpected outcome—a sudden spike in your data, a failed experiment, or a surprising survey result—and need to understand the underlying reasons.
The Core Question: What are the causal relationships that explain this outcome?
Level 3: Predictive Analysis – What Will Happen Next?
After understanding the past, you can begin to forecast the future. Predictive analysis uses historical data and statistical models to identify the likelihood of future outcomes. This is where you move from being a historian of your data to a forecaster.
Using techniques like regression analysis, clustering, and time series forecasting, you can anticipate future trends, behaviors, and potential risks.
When to Use: Use this when you need to forecast future possibilities based on past patterns, such as anticipating market demand, predicting health trends, or identifying potential risk factors in a system.
The Core Question: Based on historical data, what is likely to happen in the future?
Part 4: Prescriptive Analysis – What Should We Do About It?
This is the final and most advanced level of data analysis. It goes beyond predicting the future to recommend the best course of action to achieve a desired outcome. Prescriptive analysis combines predictive models with optimization techniques to guide strategic decision-making.
Methods like simulation analysis, decision analysis, and recommendation systems can help you test different scenarios and identify the optimal path forward.
When to Use: Use this when you need to move from insight to action. It’s ideal for recommending specific policy interventions, optimizing a process for maximum efficiency, or suggesting the best strategy to achieve a specific goal.
The Core Question: What actions should we take to achieve our desired goals?
Final Thoughts
Data analysis is a powerful journey that transforms raw information into strategic wisdom. By understanding and applying these four levels of inquiry, you can move beyond simple summaries to uncover deep insights, anticipate the future, and make informed, data-driven decisions that will elevate the impact of your research.
Frequently Asked Questions (FAQ)
- Do I need to use all four types of analysis in every research project?
Not necessarily. The type of analysis you use depends on your research question. A descriptive study might only use Level 1, while a study aimed at policy recommendations would likely progress through all four levels. The key is to match the method to your objective. - What’s the difference between Diagnostic and Predictive analysis?
Diagnostic analysis looks backward to explain why something has already happened. It is focused on cause-and-effect relationships in the past. Predictive analysis looks forward to forecast what is likely to happen in the future based on those past patterns. - Are these types of analysis only for quantitative data?
No. While some techniques are specific to numbers, the overall framework applies to all data. For example, Text Analysis is the descriptive level for qualitative data. You can then perform a Diagnostic analysis on interview transcripts to understand why certain themes emerged, and so on.